.avif)
Understand the Important Data Buried in Documents
Extract KPIs, financial metrics, and business insights from any document—get decision-ready analytics in minutes, not weeks.
- Extract financial metrics, risk indicators, and performance data automatically
- Generate custom dashboards and reports from unstructured documents
- Identify trends, anomalies, and red flags across your entire portfolio
.avif)
Trusted by


Traditional Approach
- Manual data entry teams struggling with complex document formats
With Heron
- Automated extraction with human-level accuracy and built-in quality controls
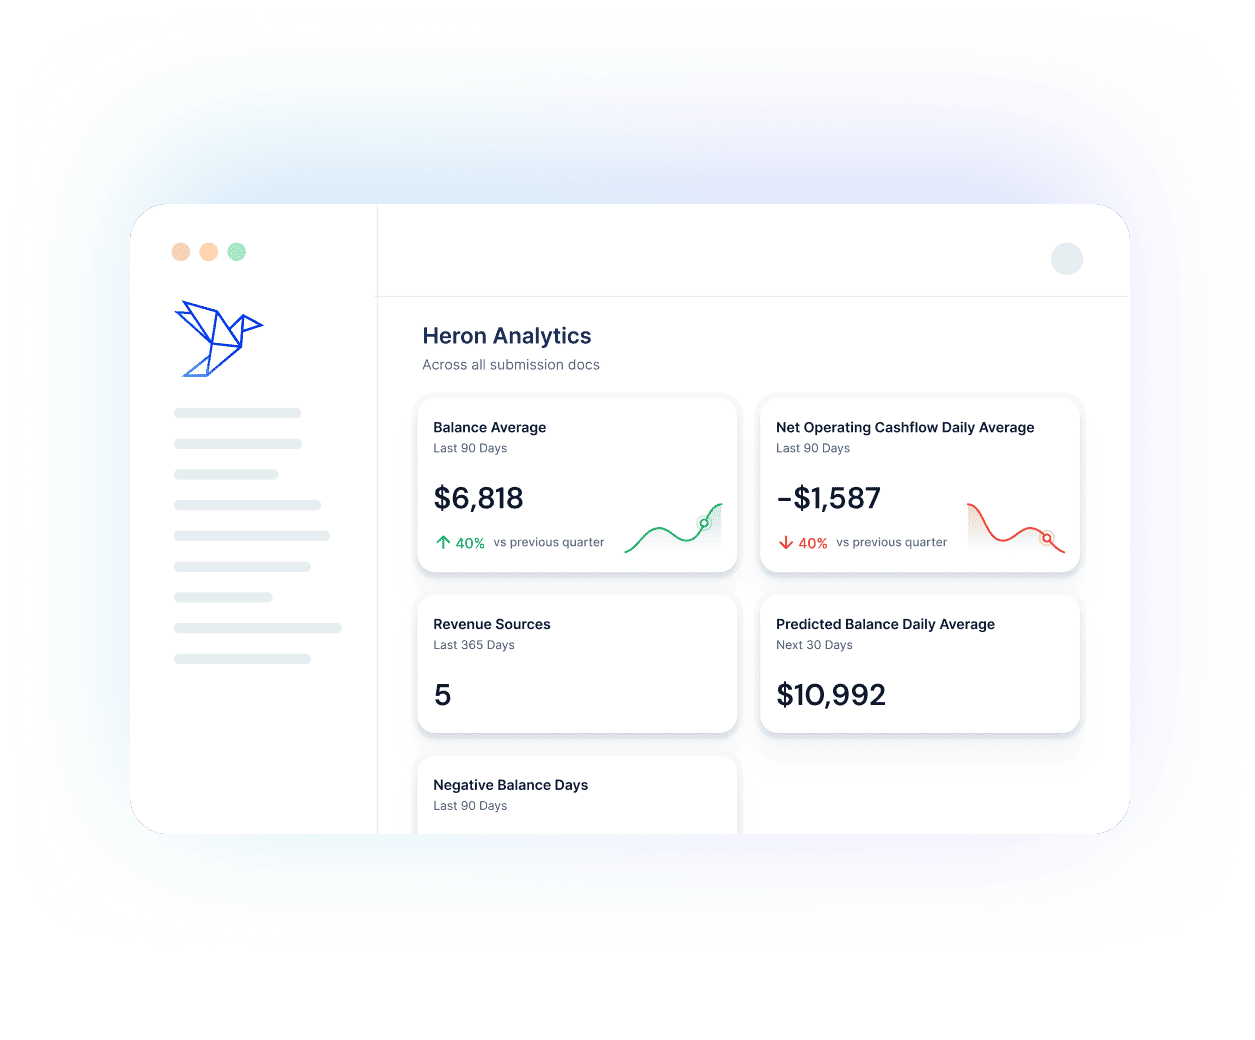
What is Heron Analytics?
Heron Analytics automatically finds and extracts key business metrics buried inside your documents and data. Instead of manually combing through reports and spreadsheets, get instant insights on financial performance, risk indicators, and operational metrics that drive better decisions. Currently, only for SMB Lending customers, and coming soon for other industries.
Extract Key Metrics Across All Submission
Heron automatically identifies and extracts critical business metrics from every document in your workflow. Whether it's balances, debts, or cashflow across submissions, Analytics pulls out the KPIs that drive your decisions without manual review of individual files.

Generate Portfolio-Wide Dashboards
Your document metrics from across all submissions are automatically aggregated into configurable dashboards with charts, graphs, and trend analysis. Get instant visibility into portfolio performance, risk indicators, and operational metrics spanning your entire book of business.

and many more..
Explore Analytics Products
Heron Analytics automatically finds and extracts key business metrics buried inside your documents and data. Instead of manually combing through reports and spreadsheets, get instant insights on financial performance, risk indicators, and operational metrics that drive better decisions. Currently, only for SMB Lending customers, and coming soon for other industries.
Configurable Analytics
Cross-Submission Intelligence
Understand Anomalies

Cash Flow Summary
Visualize trends in inflows, outflows, average balances, and burn rates across submissions. Identify financial stability (or red flags) instantly — no spreadsheet wrangling required. 🧾 Bank Statement Spreading Analytics Track parsing accuracy, monthly coverage,

Bank Statement Spreading
Track parsing accuracy, monthly coverage, and data consistency across bank statement submissions. Spot gaps, anomalies, or errors with full visibility into every account and transaction field.